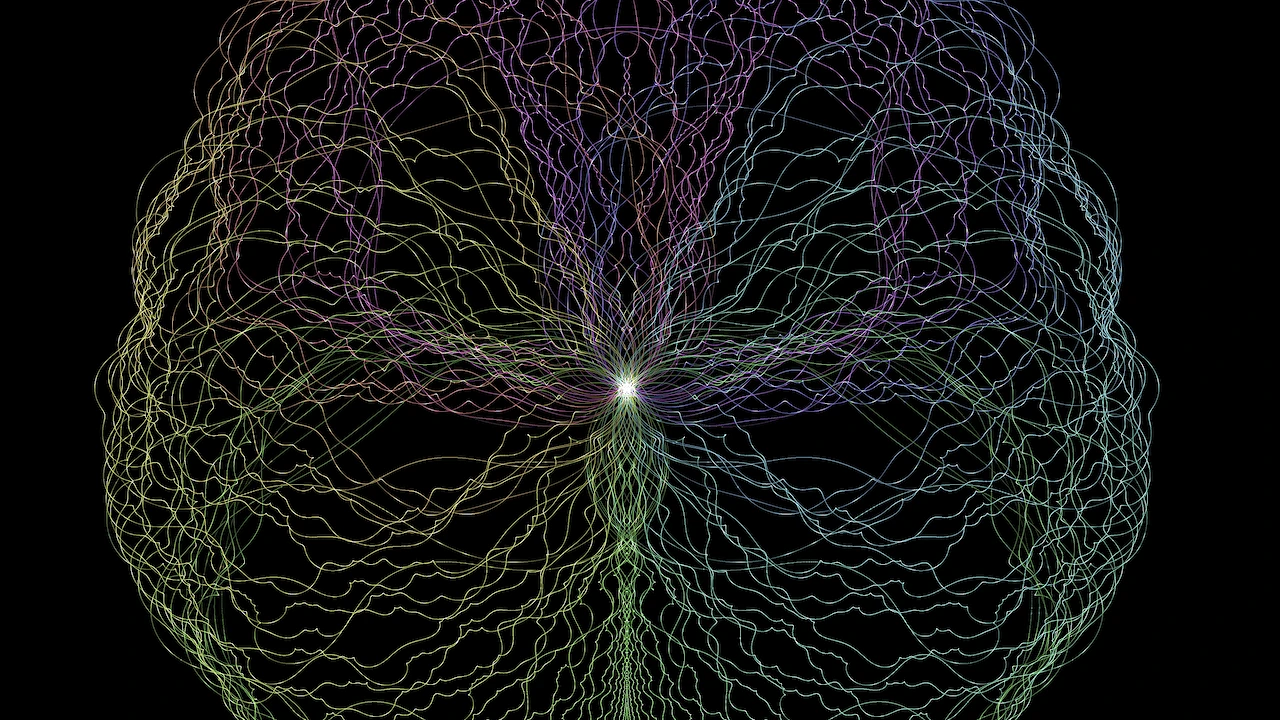
Yarnball
Buddhabrot
The Yarnball visualizes the orbit dynamics near the Mandelbrot/Buddhabrot cardioid edge by sampling c values only from a thin strip just beyond its radius. The initial c strip is shaped like the cardioid, but as the iteration count increases the sample strand becomes more and more convoluted. This image renders only the z101 points and since the c values are so close to the cardioid none of them have yet diverged, but some eventually will. However, parts of the strand which originate in the variously periodical bulbs of Mandelbrot will never diverge and instead will keep coiling tighter and tighter as the iteration depth increases.


